Interface & Consumption
Where the platform meets people: copilots inside the tools they already use, AI folded invisibly into productivity apps, and analytics driven by plain questions rather than a report queue.
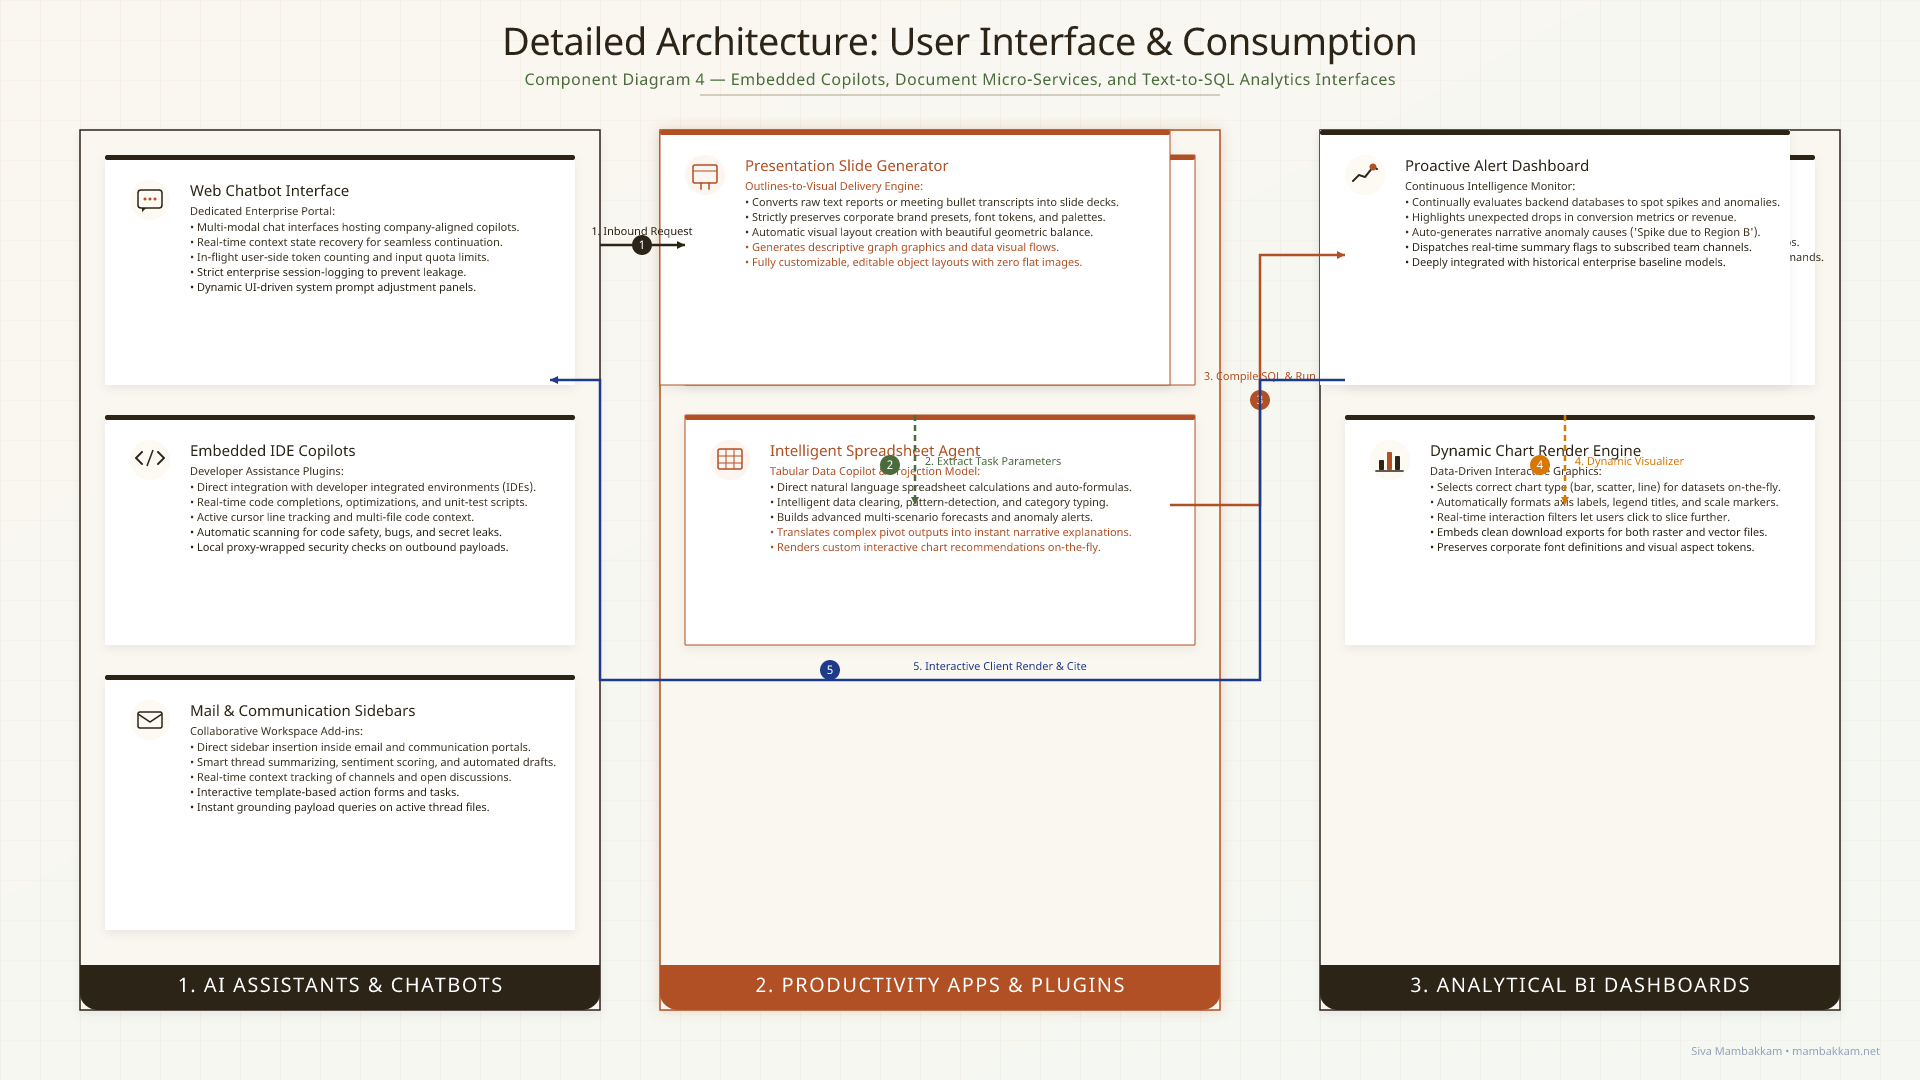
Components
AI Assistants & Chatbots
Standalone chat windows sit outside the tools people work in, and pasting corporate data into them is a compliance problem.
- Copilots embedded in the editor, mail client, and collaboration hub rather than a separate tab
- Inline suggestions — documents, snippets, draft replies — surfaced without interrupting the task
- Context taken from the open file, thread, or channel instead of asked for
Assistance where the work already happens, with interactions that stay grounded and inside the company boundary.
Productivity Apps
The highest-leverage AI is often the least visible — embedded in existing tools, not a destination of its own.
- Spreadsheet analysis that turns large tables into summaries, pivots, and projections
- Document summarisation that reduces long PDFs, transcripts, and papers to action items
- Presentation drafting that turns an outline or report into slides in the house style
Repetitive formatting and summarising handled in the background, so time goes to the decision rather than the busywork.
Analytical Dashboards
Business questions queue behind analysts; by the time a custom report is built, the moment it was for has passed.
- Text-to-SQL that turns a plain question into an optimised query against the warehouse
- Automatic chart selection appropriate to the result — series, distribution, or map
- Anomaly surfacing that flags unexpected movement directly in the view
Decision support without the report backlog, with the query and its source visible rather than hidden.